FAQs
BARC data is made by comparing satellite near and mid infrared reflectance values. The logic behind the process is as follows:
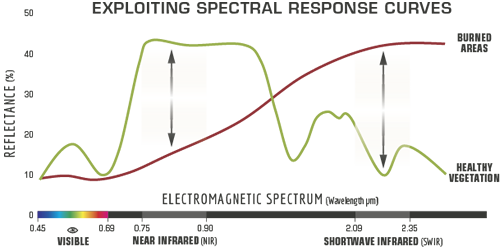
Near infrared light is largely reflected by healthy green vegetation. This means that near infrared bands will be higher in areas of healthy green vegetation and lower in areas where there is little vegetation.
Shortwave infrared light is largely reflected by rock and bare soil. This means that shortwave band values will be higher in bare, rocky areas with little vegetation and low in areas of healthy green vegetation.
Imagery collected over a forest in a pre-fire condition will have high near infrared band values and low shortwave infrared band values. Imagery collected over a forest after a fire will have lower near infrared band values and higher shortwave infrared band values.
For more information see Spectral Reflectivity Overview PDF(link is external)
It is the relationship between these two bands that the BARC attempts to exploit. The best way to do this is to measure the relationship between these bands prior to the fire and then again post fire. The areas where the relationship between the two bands has changed most indicate areas of increasing burn severity. The areas where that relationship has changed little are likely to be unburned or very lightly burned. To determine this relationship, analysts apply a normalized index that uses the shortwave and near infrared bands, the NBR. Typically, an NBR image is derived from imagery acquired before and after the fire. A dNBR is subsequently compiled by subtracting the post-fire NBR from the pre-fire NBR, which is used to delineate burned areas, and assess and classify burn severity.
In the immediate aftermath of a wildfire, a BAER team is dispatched to the site to prepare an emergency rehabilitation and restoration plan. They do this by making an initial assessment of soil burn severity and estimate the likely future downstream impacts due to flooding, landslides, and soil erosion. One of the first tasks for this team is the creation of an SBS map that highlights the areas of high, moderate, and low severity. This map then serves as a key component in the subsequent flood modeling and GIS analysis. The BARC data are meant to be used as a main input into the development of the final SBS map.
BARC products are essential tools developed for use by BAER teams. These products help assess and classify the severity of wildfires across affected landscapes, enabling rapid and targeted field assessments.
One of the primary BARC products is the BARC4 map. Created by mapping analysts, the BARC4 map categorizes fire severity into four broad classes: high, moderate, low, and unburned to low. This classification allows BAER teams to efficiently identify areas that require sampling during their field assessments.
In addition to the BARC4 map, a continuous 256-class version of the BARC known as BARC256 is also generated. Both BARC4 and BARC256 products utilize the same initial classification color scheme. BARC256 maps provide BAER team members the flexibility to adjust severity categories and make final determinations about soil burn severity.
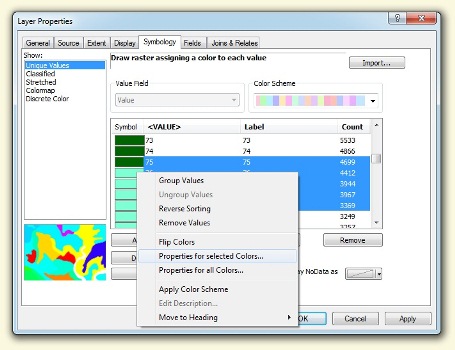
The color-coding on the BARC256 done by the mapping team members is meant to act as a starting point for field team members. Users can view the color scheme and adjust these break points as desired. This can easily be done in ArcMap. For step-by-step instructions on making break point adjustments, please refer to this document:
These data will also typically be sent as a square or rectangular subset that covers land outside the fire perimeter. This can easily be clipped to the fire perimeter of choice using ArcMap’s Spatial Analyst extension.
The colors represent burn severity classes (high, moderate, low and unburned). "Warm" colors indicate higher severity (red = "high" and yellow = "moderate") and "cool" colors indicate lower severity (blue green = "low" and and dark green = "unburned to low"). Color definitions for each class are available in the attribute table for GeoTIFFs and in legends associated with other graphic products.
Current - CVD-friendly, Section 508 update (2024 and later)
Previous - CVD-friendly, Section 508 update (2023)
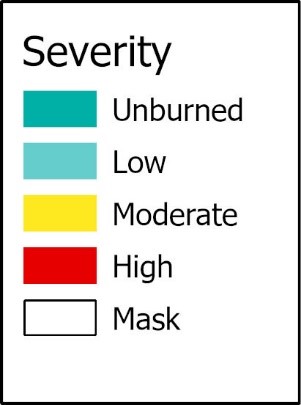
"Classic" versions (2022 and earlier)

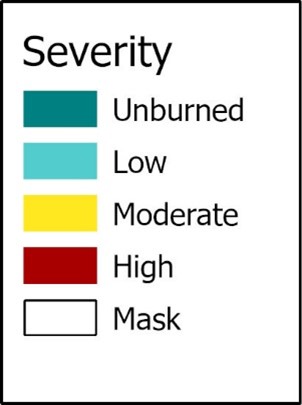
As of the 2023 fire season, the BARC4, SBS, and related products use a new color scheme designed to meet the intent of Section 508 of the Rehabilitation Act. Specifically, it is intended to be more accessible to those with common color vision deficiencies ("color blindness"). The "high" and "moderate" severity classes are still red and yellow, respectively; while the blue-green and dark green of the "low" and "unburned" classes have been replaced with lighter and darker shades of blue, respectively. Some data bundles (mostly from 2022) include both the new and original versions. As of 2023, however, the updated version is the default.
BARC and SBS products represent classifications of soil burn severity resulting from wildfire. These products are based on post-fire imagery captured immediately after a wildfire occurs to assess the need for emergency soil stabilization treatments. The RAVG program provides burn severity products that represent measures of vegetation burn severity to help assess the need for reforestation. The MTBS program provides burn severity products that represent ecological burn severity for use in assessing longer-term trends in burn severities. In higher biomass ecosystems, the MTBS program typically applies extended assessments which utilize post-fire imagery at the peak of greenness during the following growing season to account for second order fire effects in the resulting burn severity classes.